ActiveMQ Artemis plugins for Dynatrace
About
Custom Dynatrace JMX plugins for ActiveMQ Artemis broker processes.
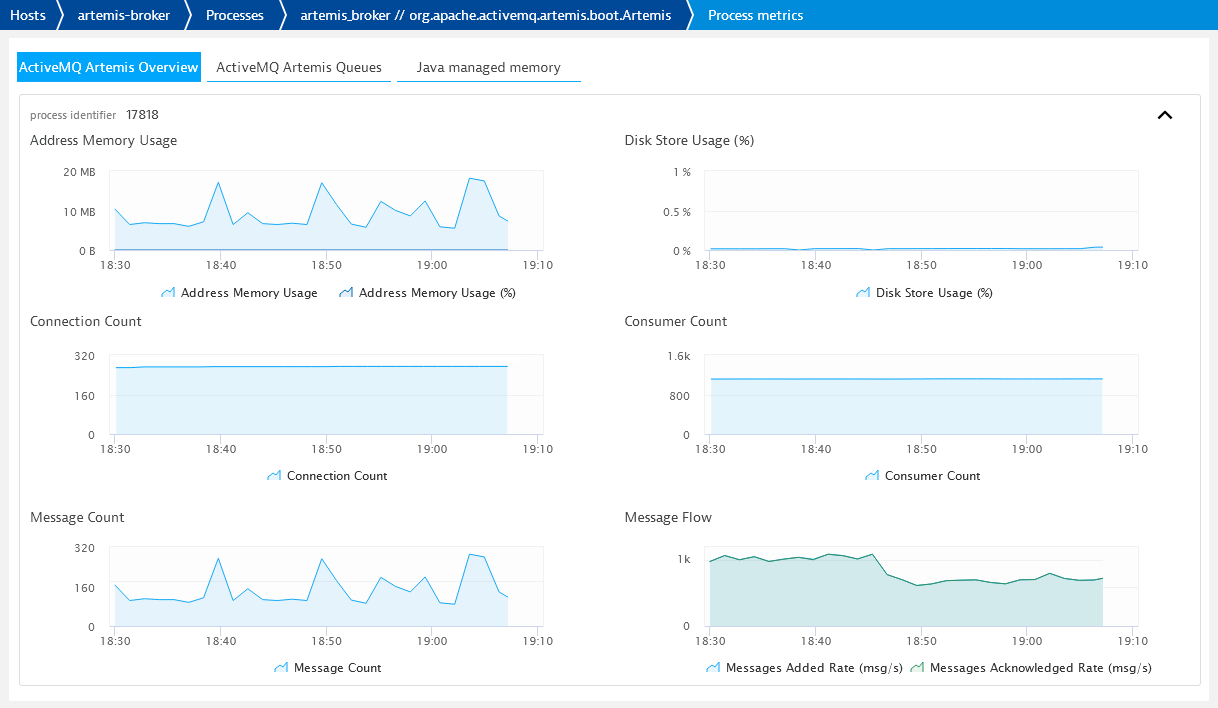
Artemis Overview Plugin
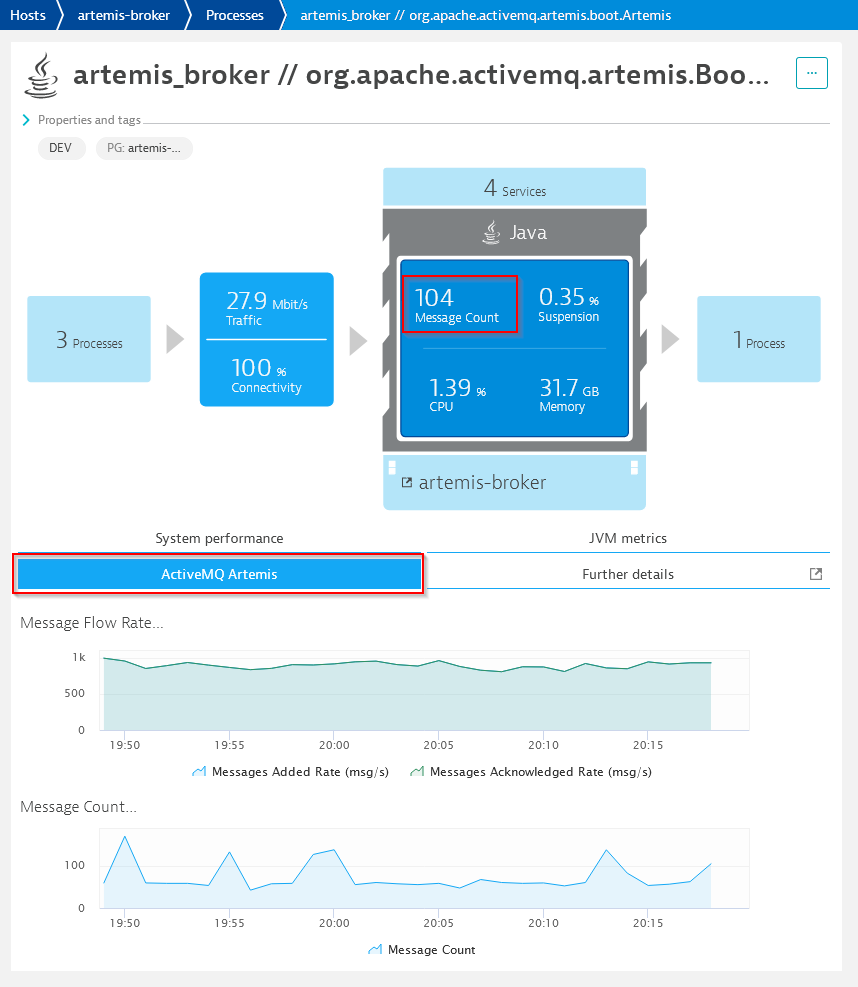
This plugin provides general broker statistics such as address memory usage, connection/consumer count, total message count, total messages added/acknowledged rate.


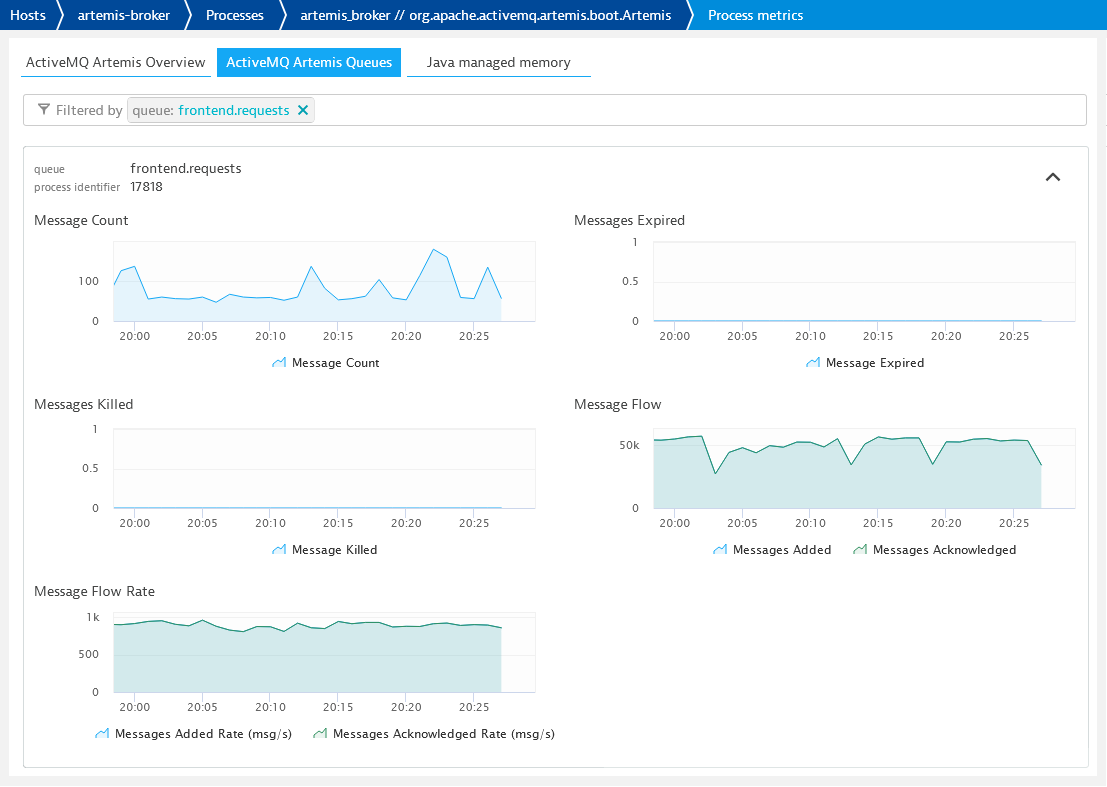
Artemis Queues Plugin
This provides detailed per-queue statistics such as current message count, messages added/acknowledged rate, consumer counts.
IMPORTANT: Activating the Artemis Queues Plugin on brokers with a VERY large number of queues may result in an overload of the broker process (100% CPU usage, denial of service) caused by the thousands of periodic JMX requests made by Dynatrace.

Installation
- You can download the latest version of the plugins here:
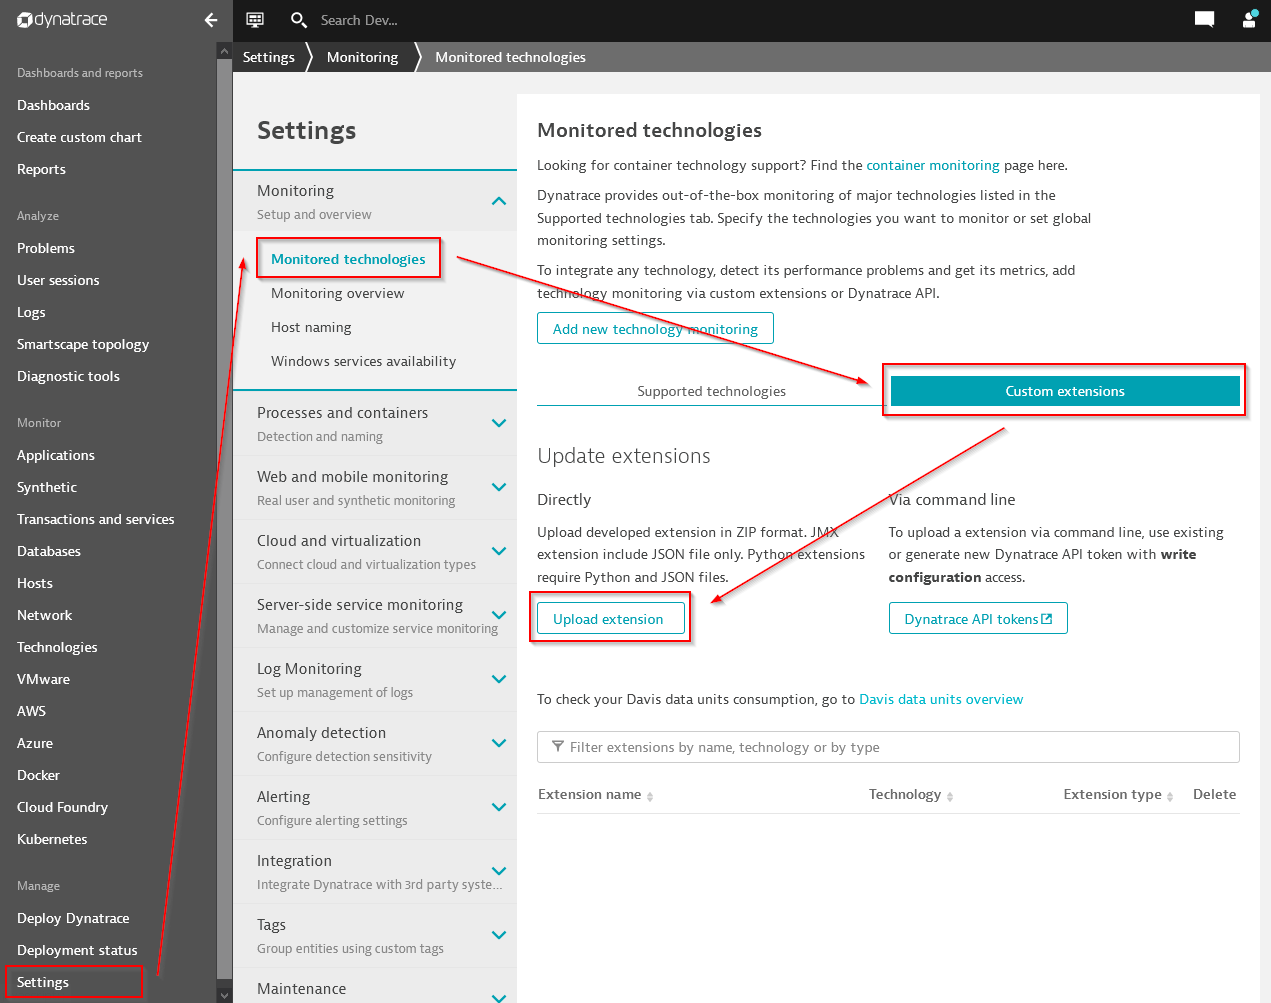
- The plugin zip file can then be installed via Manage > Settings > Monitoring > Monitored Technologies > Custom extensions > Upload extension

Update
The plugins can be updated via: Manage > Settings > Monitoring > Monitored Technologies > Custom extensions >
- ActiveMQ Artemis Overview > Upload extension
- ActiveMQ Artemis Queues > Upload extension
References
- How to monitor JMX metrics in Java applications
- Example JMX plugins
- Dynatrace Plugin SDK
- Artemis MBeans:
License
All files are released under the Apache License 2.0.
Individual files contain the following tag instead of the full license text:
SPDX-License-Identifier: Apache-2.0
This enables machine processing of license information based on the SPDX License Identifiers that are available here: https://spdx.org/licenses/.

